
We’ve all been there—it’s 2 a.m., you’re hunched over your laptop, frantically copying data from five different platforms into a spreadsheet that’s due first thing in the morning. Your eyes are burning, your coffee’s gone cold, and you’re wondering if there’s a better way to handle your automated reporting.
Here’s the truth: you don’t have to live in spreadsheet scramble mode anymore. With the right automation setup, you can transform those late-night data disasters into smooth, hands-off processes that work while you sleep.
Let’s explore how to build a reporting system that actually serves you, starting with three key areas that will give you the biggest time savings and peace of mind.
Think about how much time you spend switching between tabs—Google Analytics, social media dashboards, CRM systems, email platforms. It’s like trying to cook dinner while running between three different kitchens.
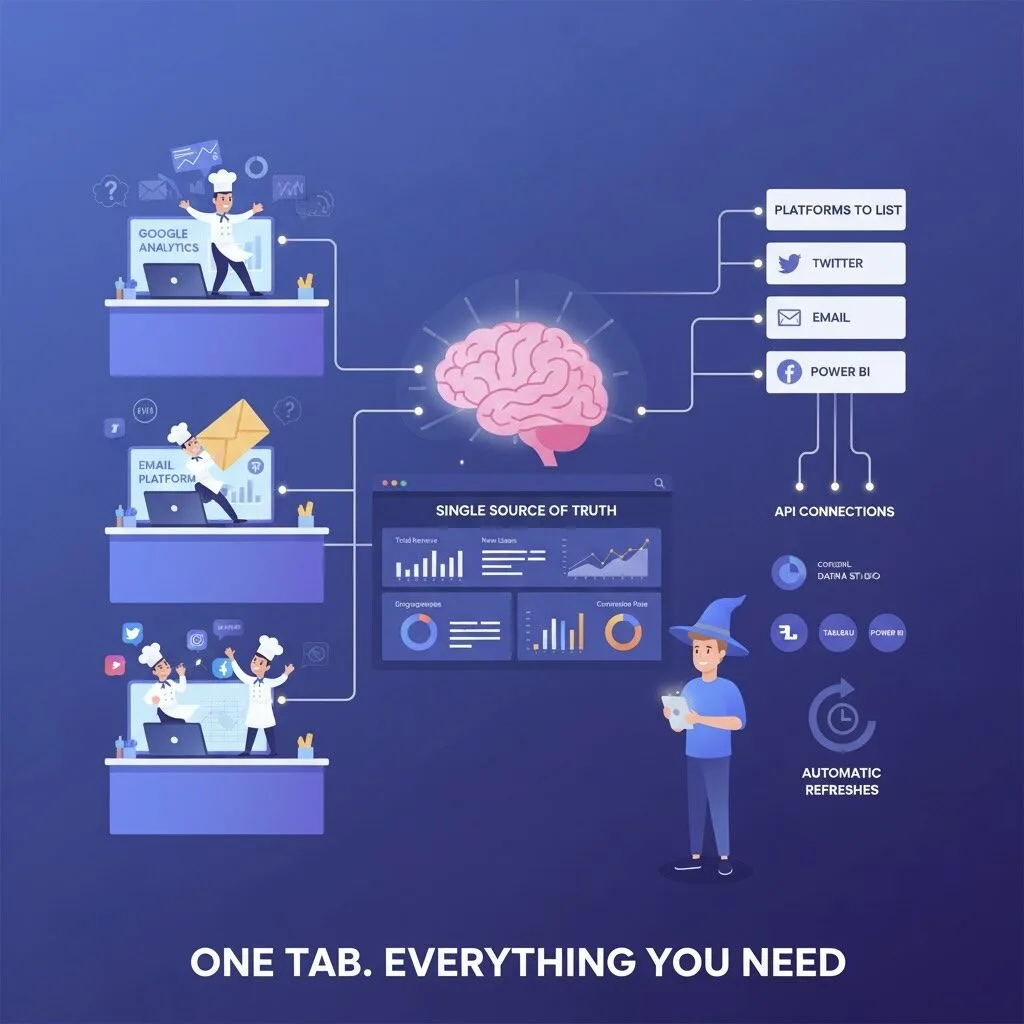
The solution is centralized data collection that automatically pulls information from all your platforms into one location. This isn’t just about convenience; it’s about creating a single source of truth for your business decisions.
Here’s how to set this up effectively:
The magic happens when you realize you can check all your key metrics in one place, with data that updates automatically. No more logging into six different accounts or worrying whether you’re looking at yesterday’s numbers.
What would it feel like to open just one tab and see everything you need to make informed decisions?
Raw data is like having all the ingredients for a meal but no recipe—technically everything’s there, but it’s not particularly useful until it’s transformed into something digestible.
This is where Make automation becomes your secret weapon. Make can take messy, inconsistent data from multiple sources and automatically clean it, format it, and present it as clear visual insights.
Here’s what this transformation process looks like:
The best part? This happens without you touching a single cell or wrestling with pivot tables. Your data visualization updates automatically, and you get insights that actually make sense at first glance.
Consider starting with one report that currently takes you the longest to create manually. Build a Make scenario around that process, and experience the relief of watching it happen automatically.
Which of your current reports would benefit most from this kind of automatic transformation?
Constantly checking your metrics is like repeatedly opening the oven to see if dinner’s ready—it doesn’t help, and it might actually slow things down. Instead of hunting for problems, let the problems find you through automated KPI alerts.
Smart alerting means you get notified when something actually needs your attention, not just when numbers change. This requires setting up thoughtful thresholds and conditions that align with your business goals.
Here’s how to create an alert system that works:
The goal is to create a system that taps you on the shoulder when something important happens, but doesn’t cry wolf every time a number fluctuates normally. You want to be informed, not overwhelmed.
Think about your current monitoring habits—are you checking things too often because you’re worried you’ll miss something important?
The journey from manual reporting chaos to automated clarity doesn’t happen overnight, and that’s perfectly fine. Small, consistent improvements compound into significant time savings and reduced stress.
Start with this simple progression: pick one report that currently frustrates you, build one Make scenario to handle it, and set one meaningful alert. The first time you don’t have to manually refresh a chart or hunt down missing data, take a moment to celebrate—that’s real progress that will build momentum for bigger changes.
Give yourself permission to start small and experiment. Even automating one weekly report saves hours every month and proves the concept works for your specific situation.
Which report would you choose to automate first, and what would you do with the time you get back?